Population growth
Population growth is the change in a population over time, and can be quantified as the change in the number of individuals of any species in a population using "per unit time" for measurement. In biology, the term population growth is likely to refer to any known organism, but this article deals mostly with the application of the term to human populations in demography.
In demography, population growth is used informally for the more specific term population growth rate (see below), and is often used to refer specifically to the growth of the human population of the world.
Simple models of population growth include the Malthusian Growth Model and the logistic model.
Population growth 1800-2011: from 1 billion to 7 billion estimated in 31.10.2011. During the year 2011 according to estimates: [1]
| Population[1] | |||
|---|---|---|---|
| Year | Billion | ||
| 1800 | 1 | ||
| 1927 | 2 | ||
| 1960 | 3 | ||
| 1974 | 4 | ||
| 1987 | 5 | ||
| 1999 | 6 | ||
| 2011* | 7 | ||
| UNFPA United Nations Population Fund estimate 31.10.2011 |
|||
- 135 million people will be born
- 57 million people will die and
- 78 million people will increase the world population.
Contents |
Determinants of population growth
Population growth is determined by four factors, births(B), deaths(D), immigrants(I), and emigrants(E). Using a formula expressed as
∆P≡(B-D)+(I-E)
In other words, the population growth of a period can be calculated in two parts, natural growth of population (B-D) and mechanical growth of population (I-E),in which Mechanical growth of population is mainly affected by social factors, e.g. the advanced economies are growing faster while the backward economies are growing slowly even with negative growth.
Population growth rate
In demographics and ecology, population growth rate (PGR) is the rate at which the number of individuals in a population increases in a given time period as a fraction of the initial population. Specifically, PGR ordinarily refers to the change in population over a unit time period, often expressed as a percentage of the number of individuals in the population at the beginning of that period. This can be written as the formula:[2]
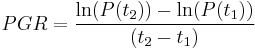
The most common way to express population growth is as a percentage, not as a rate. The change in population over a unit time period is expressed as a percentage of the population at the beginning of the time period. That is:

For small time periods and growth rates, the added population is the growth rate multiplied by the time period.
A positive growth ratio (or rate) indicates that the population is increasing, while a negative growth ratio indicates the population is decreasing. A growth ratio of zero indicates that there were the same number of people at the two times -- net difference between births, deaths a growth rate may be zero even when there are significant changes in the birth rates, death rates, immigration rates, and age distribution between the two times. [3] Equivalently, percent death rate = the average number of deaths in a year for every 100 people in the total population.
If the length of the time is taken smaller and smaller, the PGR approaches the logarithmic derivative of the population function P. If the population as a function of time is exponential, say P(t) = Ceat, the logarithmic derivative is a. Thus, the PGR approximates the exponent a for populations with exponential growth.
A related measure is the net reproduction rate. In the absence of migration, a net reproduction rate of more than one indicates that the population of women is increasing, while a net reproduction rate less than one (sub-replacement fertility) indicates that the population of women is decreasing.
Excessive growth and decline
Main articles: Overpopulation and population decline
Population exceeding the carrying capacity of an area or environment is called overpopulation. It may be caused by growth in population or by reduction in capacity. Spikes in human population can cause problems such as pollution and traffic congestion, these might be resolved or worsened by technological and economic changes. Conversely, such areas may be considered "underpopulated" if the population is not large enough to maintain an economic system (see population decline). Between these two extremes sits the notion of the optimum population.
Human population growth rate
Globally, the growth rate of the human population has been declining since peaking in 1962 and 1963 at 2.20% per annum. In 2009, the estimated annual growth rate was 1.1%.[5] The CIA World Factbook gives the world annual birthrate, mortality rate, and growth rate as 1.915%, 0.812%, and 1.092% respectively[6] The last one hundred years have seen a rapid increase in population due to medical advances and massive increase in agricultural productivity[7] made possible by the Green Revolution.[8][9][10]
The actual annual growth in the number of humans fell from its peak of 88.0 million in 1989, to a low of 73.9 million in 2003, after which it rose again to 75.2 million in 2006. Since then, annual growth has declined. In 2009, the human population increased by 74.6 million, which is projected to fall steadily to about 41 million per annum in 2050, at which time the population will have increased to about 9.2 billion.[11] Each region of the globe has seen great reductions in growth rate in recent decades, though growth rates remain above 2% in some countries of the Middle East and Sub-Saharan Africa, and also in South Asia, Southeast Asia, and Latin America.[12]
Some countries experience negative population growth, especially in Eastern Europe mainly due to low fertility rates, high death rates and emigration. In Southern Africa, growth is slowing due to the high number of HIV-related deaths. Some Western Europe countries might also encounter negative population growth.[13] Japan's population began decreasing in 2005.[14]
Growth by country
The growth by country in the world increased from 1990 to 2008 with 1,423 million and 27 % growth. As persons the increase was among highest in India 290 million and China 192 million. Population growth was among highest in Qatar 174 % and United Arab Emirates 140 %.[15]
| Rank | Country | Population (thousands) 2010 |
Population (thousands) 1990 |
Growth (%) 1990-2010 |
|---|---|---|---|---|
| World | 6,895,889 | 5,306,425 | 30.0% | |
| 1 | China | 1,341,335 | 1,145,195 | 17.1% |
| 2 | India | 1,224,614 | 873,785 | 40.2% |
| 3 | United States | 310,384 | 253,339 | 22.5% |
| 4 | Indonesia | 239,871 | 184,346 | 30.1% |
| 5 | Brazil | 194,946 | 149,650 | 30.3% |
| 6 | Pakistan | 173,593 | 111,845 | 55.3% |
| 7 | Nigeria | 158,423 | 97,552 | 62.4% |
| 8 | Bangladesh | 148,692 | 105,256 | 41.3% |
| 9 | Russia | 142,958 | 148,244 | -3.6% |
| 10 | Japan | 126,536 | 122,251 | 3.5% |
1960s to 2010 table of population growth
| Population growth 1990-2008 (%)[16] | |
|---|---|
| Africa | 55 % |
| Middle East | 51 % |
| Asia | 35 % |
| Latin America | 30 % |
| OECD North America | 24 % |
| OECD Europe | 9 % |
| OECD Pacific | 8 % |
| Former Soviet Union | -1 % |
| Non-OECD Europe | -11 % |
Many of the world's countries, including many in Sub-Saharan Africa, the Middle East, South Asia and South East Asia, have seen a sharp rise in population since the end of the Cold War. The fear is that high population numbers are putting further strain on natural resources, food supplies, fuel supplies, employment, housing, etc.; in some the less fortunate countries. The population of Chad has, for example, ultimately grown from 6,279,921 in 1993 to 10,329,208 in 2009,[17] further straining its resources. Vietnam, Mexico, Nigeria, Egypt, Ethiopia and the DRC are witnessing a similar growth in population, strained resources and a possible overpopulation problem in the near future.
The situation was most acute in northern, western and central Africa. Refugees from places like the Sudan have helped further strain the resources of neighbouring states like Chad and Egypt. The nation is also host to roughly 255,000 refugees from Sudan’s Darfur region, and about 77,000 refugees from the Central African Republic, whilst approximately 188,000 Chadians have been displaced by their own civil war and famines, have either fled to either the Sudan, the Niger or, more recently, Libya.
| Example nation | 1st Population total. | 2nd Population total. | 3rd Population total. | 4th Population total. | 5th Population total. | Life expectancy in years. | Total population growth from 1st Pop. Total to 5th Pop. Total. |
|---|---|---|---|---|---|---|---|
| Eritrea* | N/A* | N/A* | 3,437,000(1994)[18] | 4,298,269 (2002) | 5,673,520 (2008)[19] | 61 (2008)[20] | 2,236,520 (since independence) |
| Ethiopia* | 23,457,000(1967)*[21] | 50,974,000(1990)* [22] | 54,939,000(1994) [18] | 67,673,031(2003) | 79,221,000(2008)[23] | 55(2008)[20] | 55,764,000 |
| Sudan** | 14,355,000(1967)**[21] | 25,204,000(1990)** [22] | 27,361,000 (1994)**[18] | 38,114,160 (2003)** | 42,272,000(2008)**[24] | 50(2008)**[20] | 27,917,000 |
| Chad | 3,410,000(1967)[21] | 5,679,000(1990) [22] | 6,183,000 (1994)[18] | 9,253,493(2003) | 10,329,208 (2009)[17] | 47(2008)[20] | 6,919,205 |
| Niger | 3,546,000(1967)[21] | 7,732,000(1990) [22] | 8,846,000(1994)[18] | 10,790,352 (2001) | 15,306,252 (2009)[25] | 44 (2008)[20] | 11,760,252 |
| Nigeria | 61,450,000(1967)[21] | 88,500,000(1990) [22] | 108,467,000 (1994)[18] | 129,934,911 (2002) | 158,259,000 (2008)[26] | 47(2008)[20] | 96,809,000 |
| Mali | 4,745,000(1967)[21] | 8,156,000(1990),[22] | 10,462,000(1994)[18] | 11,340,480(2002) | 14,517,176(2010).[27] | 50(2008)[20] | 9,772,176 |
| Mauritania | 1,050,000(1967)[21] | 2,025,000(1990) [22] | 2,211,000 (1994)[18] | 2,667,859 (2003) | 3,291,000 (2009)[17] | 54(2008)[20] | 2,241,000 |
| Senegal | 3,607,000(1967)[21] | 7,327,000(1990) [22] | 8,102,000 (1994) [18] | 9,967,215(2002) | 13,711,597 (2009)[28] | 57(2008)[20] | 10,104,597 |
| Gambia | 343,000(1967)[21] | 861,000(1990) [22] | 1,081,000 (1994)[18] | 1,367,124 (2000) | 1,705,000(2008)[26] | 55(2008)[20] | 1,362,000 |
| Algeria | 11,833,126 (1966)[21] | 25,012,000 (1990) [22] | 27,325,000 (1994) [18] | 32,818,500 (2003) | 34,895,000[23][29](2008) | 74 (2008)[20] | 23,061,874 |
| The DRC/Zaire | 16,353,000(1967)[21] | 35,562,000 (1990) [22] | 42,552,000 (1994) [18] | 55,225,478 (2003) | 70,916,439 (2008) [23][30] | 54(2008)[20] | 54,563,439 |
| Egypt | 30,083,419 (1966)[21] | 53,153,000 (1990) [22] | 58,326,000 (1994) [18] | 70,712,345 (2003) | 79,089,650 [31][31] (2008) [23] | 72 (2008)[20] | 49,006,231 |
| Réunion (French colony) | 418,000 (1967)[21] | N/A(1990) [22] | N/A (1994)[18] | 720,934 (2003) | 827,000 (2009) [29] | N/A (2008)[20] | 409,000 |
| The Falkland Islands (UK colony) | 2,500(1967)[21] | N/A(1990) [22] | N/A(1994)[18] | 2,967 (2003) | 3,140(2010)[17] | N/A(2008)[20] | 640 |
| Chile | 8,935,500(1967)[21] | 13,173,000 (1990) [22] | 13,994,000(1994)[18] | 15,116,435 (2002) | 17,224,200 (2011) | 77 (2008)[20] | 8,288,700 |
| Colombia | 19,191,000(1967)[21] | 32,987,000(1990) [22] | 34,520,000(1994)[18] | 41,088,227 (2002) | 45,925,397(2010)[32] | 73 (2008)[20] | 26,734,397 |
| Brazil | 85,655,000(1967)[21] | 150,368,000 (1990) [22] | 153,725,000 (1994)[18] | 174,468,575 (2000) | 190,732,694(2010) [33] | 72(2008)[20] | 105,077,694 |
| Mexico | 45,671,000(1967)[21] | 86,154,000(1990) [22] | 93,008,000(1994)[18] | 103,400,165 (2000) | 112,322,757(2010)[34] | 76(2008)[20] | 66,651,757 |
| Fiji | 476,727 (1966)[21] | 765,000(1990) [22] | 771,000 (1994)[18] | 844,330 (2001) | 849,000[29] (2010) | 70 (2008)[20] | 372,273 |
| Nauru | 6,050(1966)[21] | 10,000(1990) [22] | N/A (1994)[18] | 12,329 (2002) | 9,322 (2011)[35] | N/A (2008)[20] | 3,272 |
| Jamaican | 1,876,000 (1967)[21] | 2,420,000 (1990) [22] | 2,429,000 (1994)[18] | 2,695,867 (2003) | 2,847,232[36](2010) | 74 (2008)[20] | 971,232 |
| Australia | 11,540,764 (1964)[21] | 17,086,000 (1990) [22] | 17,843,000 (1994)[18] | 19,546,792 (2003) | 22,858,456[37] (2010) | 82 (2008)[20] | 11,066,508 |
| Albania | 1,965,500(1964)[21] | 3,250,000 (1990) [22] | 3,414,000 (1994)[18] | 3,510,484 (2002) | 2,986,952 (July 2010 est.)[17][38] (2010) | 78 (2008)[20] | 1,021,452 |
| Poland | 31,944,000(1967)[21] | 38,180,000 (1990) [22] | 38,554,000 (1994)[18] | 38,626,349 (2001) | 38,192,000(2010)[39] | 75 (2008)[20] | 6,248,000 |
| Hungary | 10,212,000(1967)[21] | 10,553,000 (1990) [22] | 10,261,000 (1994)[18] | 10,106,017 (2002) | 9,979,000(2010)[40] | 73 (2008)[20] | -142,000 |
| Bulgaria | 8,226,564(1965)[21] | 8,980,000 (1990) [22] | 8,443,000 (1994)[18] | 7,707,495(2000) | 7,351,234 (2011)[41] | 73 (2008)[20] | -875,330 |
| UK | 55,068,000 (1966)[21] | 57,411,000 (1990) [22] | 58,091,000 (1994) [18] | 58,789,194 (2002) | 62,008,048 (2010)[42] | 79(2008)[20] | 7,020,048 |
| Ireland/Éire | 2,884,002(1966)[21] | 3,503,000(1990) [22] | 3,571,000 (1994)[18] | 3,840,838 (2000) | 4,470,700 [43] (2010) | 78 (2008)[20] | 1,586,698 |
| The PRC/China | 720,000,000(1967)[21] | 1,139,060,000(1990) [22] | 1,208,841,000 (1994)[18] | 1,286,975,468 (2004) | 1,339,724,852(2010)[44] | 73 (2008)[20] | 619,724,852 |
| Japan*** | 98,274,961(1965)[21] | 123,537,000(1990) [22] | 124,961,000 (1994)[18] | 127,333,002 (2002) | 127,420,000 (2010)[45] | 82(2008)[20] | 28,123,865 |
| Ryukyu Islands (Once occupied by America)*** | 934,176(1965)[21] | — | — | — | — | — | — |
| India# | 511,115,000 (1967)[21] | 843,931,000 (1990) [22] | 918,570,000 (1994)[18] | 1,028,610,328 (2001) | 1,210,193,422(2011)[46] | 69 (2008)[20] | 699,078,422 |
| Population (1000 million) and growth 1990-2008 (%) | |||
|---|---|---|---|
| 1990 | 2008 | % | |
| Eritrea* (1992) | 3184 | 5674 | 78 % |
| Ethiopia* | 50974 | 79221 | 55 % |
| Sudan** | 25204 | 42272 | 68 % |
| Chad (2009) | 5679 | 10329 | 82 % |
| Niger (2009) | 7732 | 15306 | 98 % |
| Nigeria | 88500 | 158259 | 79 % |
| Mali (2010) | 8156 | 14517 | 78 % |
| Mauritania (2009) | 2025 | 3291 | 63 % |
| Senegal (2009) | 7327 | 13712 | 87 % |
| Gambia | 861000 | 1705000 | 98 % |
| Algeria | 25012 | 34895 | 40 % |
| Zaire | 35562 | 70916 | 99 % |
| Egypt | 53153 | 79090 | 49 % |
| Chile (2011) | 13173 | 17224 | 31 % |
| Colombia (2010) | 32987 | 45925 | 39 % |
| Brazil (2010) | 150368 | 190733 | 27 % |
| Mexico (2010) | 86154 | 112323 | 30 % |
| Fiji (2010) | 765 | 849 | 11 % |
| Nauru (2011) | 10000 | 9322 | -7 % |
| Jamaican (2010) | 2420 | 2847 | 18 % |
| Australia (2010) | 17086 | 22687 | 33 % |
| Albania (2010) | 3250 | 2987 | -8 % |
| Poland(2010) | 38180 | 38192 | 0 % |
| Hungary (2010) | 10553 | 9979 | -5 % |
| Bulgaria (2011) | 8980 | 7351 | -18 % |
| UK (2010) | 57411 | 62008 | 8 % |
| Ireland/Éire (2010) | 3503 | 4471 | 28 % |
| China(2010) | 1139060 | 1339725 | 18 % |
| Japan (2010) | 123537 | 127420 | 3 % |
| India (2011) | 843931 | 1210193 | 43 % |
| Year after country if different, refs as in the previous table | |||
| Population growth 1990-2008 (%)[16] | |||
|---|---|---|---|
| Qatar | 174 % | ||
| UAE | 140 % | ||
| Jordan | 86 % | ||
| Benin | 81 % | ||
| Congo | 69 % | ||
| Angola | 69 % | ||
| Tanzania | 67 % | ||
| Syria | 67 % | ||
| Togo | 65 % | ||
| Kenya | 64 % | ||
| Côte d'Ivoire | 63 % | ||
| Senegal | 62 % | ||
| Mozambique | 61 % | ||
| Nigeria | 60 % | ||
| Zambia | 60 % | ||
| Singapore | 59 % | ||
| Eritrea | 57 % | ||
| Ethiopia | 57 % | ||
| Gabon | 56 % | ||
| Israel | 56 % | ||
| Ghana | 56 % | ||
| Iraq | 56 % | ||
| Bahrain | 56 % | ||
| Brunei | 54 % | ||
| Cameroon | 54 % | ||
| Pakistan | 54 % | ||
| Guatemala | 54 % | ||
| Sudan | 53 % | ||
| Oman | 51 % | ||
- Notes
- * Eritrea left Ethiopia in 1991.
- ** Split in to the nations of Sudan and Southern Sudan during 2011.
- *** Merged in 1972.
- # Merged in 1975.
Into the future
According to projections, the world population will continue to grow until at least 2050, with the population reaching 9.1 billion in 2050.[47]
See also
- Baby boom
- Population bottleneck
- Population decline
- Population pyramid
- Carrying capacity
- Demographic economics
- Demographic momentum
- Demographic transition
- Density dependent inhibition
- Exponential growth
- Compound annual growth rate
- Doubling time
- Biological exponential growth
- Family planning
- Fatal Misconception: The Struggle to Control World Population
- Fertility rate
- Green Revolution
- Natalism and Antinatalism
- Optimum Population
- Overpopulation
- Urban sprawl
- Immigration
- Immigration reduction
- Rank mobility index
- World population
- World population estimates
- Logistic function - concept related to logistic model
- Ronald Fisher - who referred to the population growth rate as the Malthusian Parameter
- List of countries by fertility rate
- List of countries by population growth rate
References
- ^ a b 7. miljardis ihminen, Helsingin Sanomat editor Mr Timo Paukku 5.9.2011 D1 (Finnish)
- ^ Enns, Richard. It's a Nonlinear World. Springer, 2010, p. 4.
- ^ Association of Public Health Epidemiologists in Ontario
- ^ Population growth rate
- ^ U.S. Census Bureau, January 2010
- ^ World Factbook
- ^ BBC NEWS | The end of India's green revolution?
- ^ Food First/Institute for Food and Development Policy
- ^ Rising food prices curb aid to global poor
- ^ Record rise in wheat price prompts UN official to warn that surge in food prices may trigger social unrest in developing countries
- ^ U.S. Census Bureau, January 2010
- ^ U.S. Census Bureau, June 2009
- ^ UN population projections
- ^ Japan sees biggest population fall
- ^ CO2 Emissions from Fuel Combustion Population 1971-2008 IEA (pdf pages 83-85)
- ^ a b CO2 Emissions from Fuel Combustion Population 1971-2008 IEA
- ^ a b c d e "Falkland Islands (Islas Malvinas)". CIA. https://www.cia.gov/library/publications/the-world-factbook/geos/fk.html. Retrieved 5 March 2010.
- ^ a b c d e f g h i j k l m n o p q r s t u v w x y z aa ab ac ad ae af The British Collins Longman Student Atlas, the 1996 and in 1998 publications, ISBN 978-0004488790 for the 1998 edition, ISBN 0-00-448365-0 for the 1996 edition
- ^ url=http://www.un.org/esa/population/publications/wpp2008/wpp2008_text_tables.pdf
- ^ a b c d e f g h i j k l m n o p q r s t u v w x y z aa ab ac ad ae af 'Modern School Atlas (96th edition)', ISBN 978-1-84907-013-3.
- ^ a b c d e f g h i j k l m n o p q r s t u v w x y z aa ab ac ad ae af The British Oxford economic atlas of the World 4th edition, ISBN 019 8941072
- ^ a b c d e f g h i j k l m n o p q r s t u v w x y z aa ab ac ad ae The British Collins Atlas of the World, the 1993 edition, ISBN 0-0044-8038-4
- ^ a b c d Ethiopia Central Statistics Office -- Population Projection for mid-2008
- ^ Department of Economic and Social Affairs (PDF). World Population Prospects, Table A.1. 2008 revision. United Nations. http://www.un.org/esa/population/publications/wpp2008/wpp2008_text_tables.pdf.
- ^ Central Intelligence Agency (2009). "Niger". The World Factbook. https://www.cia.gov/library/publications/the-world-factbook/geos/ng.html. Retrieved January 10, 2010.
- ^ a b Department of Economic and Social Affairs Population Division (2009) (PDF). World Population Prospects, Table A.1. 2008 revision. United Nations. http://www.un.org/esa/population/publications/wpp2008/wpp2008_text_tables.pdf. Retrieved 2009-03-12.
- ^ "Mali preliminary 2009 census". Institut National de la Statistique. http://instat.gov.ml/voir_actu.aspx?lactu=44. Retrieved January 12, 2010.
- ^ Central Intelligence Agency (2009). "Senegal". The World Factbook. https://www.cia.gov/library/publications/the-world-factbook/geos/sg.html. Retrieved January 10, 2010.
- ^ a b c Department of Economic and Social Affairs Population Division (2010) (PDF). World Population Prospects, Table A.1. 2008 revision. United Nations. http://www.un.org/esa/population/publications/wpp2010/wpp2010_text_tables.pdf. Retrieved 2009-03-12.
- ^ The World Factbook- Congo, Democratic Republic of the. Central Intelligence Agency.
- ^ a b "Central Agency for Population Mobilisation and Statistics — Population Clock (July 2008)". Msrintranet.capmas.gov.eg. http://www.msrintranet.capmas.gov.eg/pls/fdl/tst12e?action=&lname=. Retrieved 2010-08-25.
- ^ "Departamento Administrativo Nacional de Estadística". Dane.gov.co. http://www.dane.gov.co/reloj/reloj_animado.php. Retrieved 2010-08-22.
- ^ IBGE. Censo 2010: população do Brasil é de 190.732.694 pessoas.
- ^ "INEGI 2010 Census Statistics". inegi.org.mx. http://www.inegi.org.mx/inegi/contenidos/espanol/prensa/comunicados/rpcpyv10.asp. Retrieved 2010-11-25.
- ^ Central Intelligence Agency (2011). "Nauru". The World Factbook. https://www.cia.gov/library/publications/the-world-factbook/geos/nr.html. Retrieved 12 February 2011.
- ^ https://www.cia.gov/library/publications/the-world-factbook/geos/jm.html
- ^ "Population clock". Australian Bureau of Statistics website. Commonwealth of Australia. http://www.abs.gov.au/ausstats/abs@.nsf/94713ad445ff1425ca25682000192af2/1647509ef7e25faaca2568a900154b63?OpenDocument. Retrieved 12 April 2011. The population estimate shown is automatically calculated daily at 00:00 UTC and is based on data obtained from the population clock on the date shown in the citation.
- ^ Population Forecast to 2060 by International Futures hosted by Google Public Data Explorer
- ^ "Wzrasta liczba ludności Polski - Wiadomości - WP.PL". Wiadomosci.wp.pl. 2010-07-23. http://wiadomosci.wp.pl/kat,1347,title,Wzrasta-liczba-ludnosci-Polski,wid,12502858,wiadomosc.html. Retrieved 2010-07-27.
- ^ Hungarian Central Statistical Office. Retrieved 25 July 2010.
- ^ http://www.nsi.bg/EPDOCS/Census2011pr.pdf
- ^ "Total population at 1 January". Eurostat. 11 March 2011. http://epp.eurostat.ec.europa.eu/tgm/table.do?tab=table&language=en&pcode=tps00001&tableSelection=1&footnotes=yes&labeling=labels&plugin=1. Retrieved 29 April 2011.
- ^ "CSO – Population and Migration Estimates April 2010" (PDF). September 2010. http://www.cso.ie/releasespublications/documents/population/current/popmig.pdf. Retrieved 21 September 2010.
- ^ Communiqué of the National Bureau of Statistics of People's Republic of China on Major Figures of the 2010 Population Census
- ^ Official Japan Statistics Bureau estimate
- ^ "Provisional Population Totals - Census 2011". Indian Census Bureau 2011. http://www.censusindia.gov.in/2011-prov-results/indiaatglance.html. Retrieved 2011-03-29.
- ^ "U.N.: Population to top 9 billion by 2050. CNN. February 25, 2005
External links
- 2008 Essays on Population Growth Blue Planet United — Population Press
- World population growth and trends 1950-2050 US Census
- UN University annual "State of the Future" report, including updates on Millennium Project goals including balancing global population growth & resources
- BBC News - Birth rate 'harms poverty goals' - 08/12/06
- Trend of growth rate with total global population
- Visual representation of global population and other statistics
- Tsirel, S. V. 2004. On the Possible Reasons for the Hyperexponential Growth of the Earth Population. Mathematical Modeling of Social and Economic Dynamics / Ed. by M. G. Dmitriev and A. P. Petrov, pp. 367–9. Moscow: Russian State Social University, 2004.
- Rosling, Hans (25 January 2009). "What stops population growth?". Gapminder. http://www.gapminder.org/videos/what-stops-population-growth/. Retrieved 2009-07-06.
|
|||||||||||||||||||||||